Posts tagged "UTHM"

Flood Monitoring & Detection System Using Internet of Thing (IoT)

January 19th, 2018 Posted by IOT PLATFORM 0 thoughts on “Flood Monitoring & Detection System Using Internet of Thing (IoT)”

In Malaysia, the flood is one of the frequent disasters that occurred in the monsoon season especially at the end of each year. The flood monitoring and detection system are important to minimize flood damage costs because the cost of damaged caused by the floods is correlated closely with the period of warning given before the flood event occurred. Because of this, the purpose of this project is to design and develop a flood monitoring and detection system using the Internet of Thing (IoT).

The main objective of the proposed system is to provide information on the current water level in the particular area, such as river and drain. When, the water level increase beyond the critical level, the system sends the alert notification to the user. The system will give alert for three-level that are Standby level (Green LED), Evacuate level (Yellow LED) and Danger level (Red LED). The system consists of an ultrasonic sensor, Arduino UNO as the system microcontroller, WiFi or GSM module, and FAVORIOT platform.  WiFi module is used to established connection to the internet. The WEMOS-D1R2 must be set and connected to the WiFi. The current water level is pushed to the FAVORIOT platform and can be viewed in a graph. Figure 1 shows the system design of the proposed system with WiFi module. As an alternative, for an area without a WiFi connection, GSM module can be integrated with the system, and the current water level can be sent to the user via SMS.

Figure 1: Block diagram of the system with WIFI module

The design of the system with GSM module is shown in Figure 2.

Figure 2: Block diagram of the system with GSM/GPRS module
Figure 3: 3D view of the project with dimension
Figure 4: Data stream of water level measurement in FAVORIOT platform
Figure 5: Graph plotted automatically based on the received data streams in Favoriot Platform.
Figure 6: Received SMS notification via GSM

[NOTE: This project is being done by UTHM, our FAVORIOT’s University’s collaborator. Article was written by Muhamad Nabil Asyraf Bin Ghazali and Supervisor: Dr. Ansar bin Jamil]

IoT Based Weather Station by using Raspberry Pi 3

January 3rd, 2018 Posted by IOT PLATFORM, NEWS, SMARTCITY 0 thoughts on “IoT Based Weather Station by using Raspberry Pi 3”

Abstract

The aim of this project is to create an online weather system which enables a user to check real-time weather parameters of a place anytime and anywhere with just a few buttons click. In this project, a weather station will be built to collect weather parameters. Data collected will then store into Google Cloud and analysis of weather will be done. A mobile app or web will be developed to display the real-time weather conditions and users will receive notification as a reminder to get themselves prepared for their plans.

Project Introduction

Weather condition plays an important role in our daily life as weather and climate are the most ubiquitous factors for home and environment planning. Moreover, the tremendous development of Internet nowadays made possible to monitor weather conditions and collect the respective data in-situ. All the objects, sensors and devices can be linked through the Internet to share and analyze the data collected at various locations. The IoT can be much more extensive in predicting and knowing the weather conditions in particular place by connecting this weather station to the Internet.

The climate of Malaysia is so capricious that hard to predict nowadays. As people grow into a developed country with advanced technology to help humanity and bring convenience to the society, it is now the time for the weather broadcasting to be implemented into the mobile phone instead of keep on checking through only television or radio. However, with the mobile weather checking syste, we have in this era still often we see people rushing for schedule under the rain without umbrella; laundries are still showering by rain; home planted plants are wilted due to the hot and dry weather.

Therefore, the objective of this project is to create an online weather system which enables the user to check real-time weather parameters of a place anytime and anywhere with just a few buttons click. On top of that, people will receive real-time notification or reminder to get themselves prepared for their plans in the current weather.


Figure 1: Overall flow of project


Figure 2: Project architecture

Favoriot platform is chosen because it is a new cloud-based platform designed for IoT which supports the integration, collection, and storage of data from several devices into the internet. It has a scalable big data storage. It also helps developers in building vertical applications to display data in many forms. Favoriot platform is suitable to be used in this project that needs several functions provided in this platform in order to obtain desired results.

Design Methodology

There are three phases to achieve the stated objectives above:

Weather station design and prototype development

These weather parameters are measured using Sparkfun Weather Shield sensor and the Raspberry Pi 3 with built-in Wi-Fi is used to capture all the data from the weather sensor. The measurements taken include temperature, humidity, atmospheric pressure, light intensity, wind speed and direction, and rain precipitation.

Transferring data to initial state cloud platform

Raspberry Pi 3 will stream the data directly to the cloud. Cloud platform that are suggested to be used in this project are Favoriot because it fully managed data, supports monitoring, logging, and diagnostics, data analysis and helps developers in building vertical applications.

Application of Internet of Things (IoT)

A stream of weather parameters/information can be displayed in a professional graphical fashion which can be accessed from mobile phone or web. Favoriot also allows the development of next generation of applications of the web that is reliable, fast and engaging. Real-time notification will then be sent to the user as a reminder.

Figure 3: Flowchart of the project

Preliminary Result

The SparkFun Weather Shield with built-in Si7021 humidity/temperature sensor, MPL3115A2 barometric pressure sensor, and the ALS-PT19 light sensor was connected to Raspberry Pi 3 as shown in Figure 4.


Figure 4: The hardware of this project

The weather parameters such as temperature, humidity, and pressure are taken from the weather shield and loaded into Raspberry Pi 3. The weather parameters were displayed at the Lx terminal of the VNC viewer as shown in Figure 5. Data collected from the sensors were successfully streamed into Favoriot and shown in the dashboard as shown in Figure 6. However, the data streamed into the Favoriot is not tally with the data collected from the sensors as for now.  In addition, the current weather conditions are updated to multiple social media every hour to notify the user as shown in Figure 7. The number of update post can be determined by modifying the python code.


Figure 5: The weather parameters displayed in Lx terminal of Raspberry Pi 3


Figure 6: Data is being streamed and displayed in Favoriot


Figure 7: Twitter post showing the current weather condition


Expected Result

The expected results toward the end of this project are described as below:

Prototype

A prototype of weather station by using Raspberry Pi 3 and Sparkfun Weather Shield sensor is designed and developed for climatology monitoring. The weather station is able to be interfaced to the Favoriot cloud platform. Weather parameters are able to be collected and saved in the cloud.

Application

Weather parameters can be analyzed online with graphical presentation. People can access the weather-related information via mobile phone or web easily. Notifications will be sent to the users too as a reminder.


Figure 8: Expected results of Favoriot data analytics for weather parameters in (a) line chart and (b) column chart.


Figure 9: Expected results of weather app development using Favoriot platform


[Note: This project is being done by UTHM, our FAVORIOT’s University collaborator. Article was written by Pui Yan Muck]

You can check out the whole LIST of IOT PROJECTS by our University Collaborators.

Monitoring Water Leakage System

January 2nd, 2018 Posted by IOT PLATFORM, SMARTCITY 0 thoughts on “Monitoring Water Leakage System”

Internet of Things (IoT) is a global network of smart devices that can be sensed and interacted with the environment using the internet as a platform for the communication and interaction with other users and systems. The main concept behind every IoT technology and its implementation is “Devices are integrated with the virtual world of internet and interact with it by tracking, sensing and monitoring objects and their environment”.  It also can collect and transmit data, actuate devices based on triggers and receive information.

Water is one of the most important substances for people on earth. Nowadays, people demand something that can influence their daily lifestyle, in a good way. Lots of people do not realize the importance of water because water is a limited resource, but useful in industry and agriculture. By using water monitoring system water wastage can be avoided. Since the water leakage cannot be detected automatically, some of the people do not make a fuss about the problem at all. Thus, the bill of water consumption will increase and this system will help to save cost on the bill, by detecting the leakage of the water at certain points in a pipeline.

Most of the people are unaware of the leakage of water which has been occurred in their environment. Therefore water leakage monitoring system is proposed. Water leakage at certain points can be detected by monitoring flow of water in the pipeline by using Water Flow Sensor. In addition, the amount of water that has been wasted due to the unattended water consumption can be reduced. In order to detect water leakage in the pipeline, the pressure of water will be measured by using the water flow sensor. Once the pressure level is detected,  the LCD will display the current water flow rate and the GSM will notify the user about the­­ leakage.

Flowchart

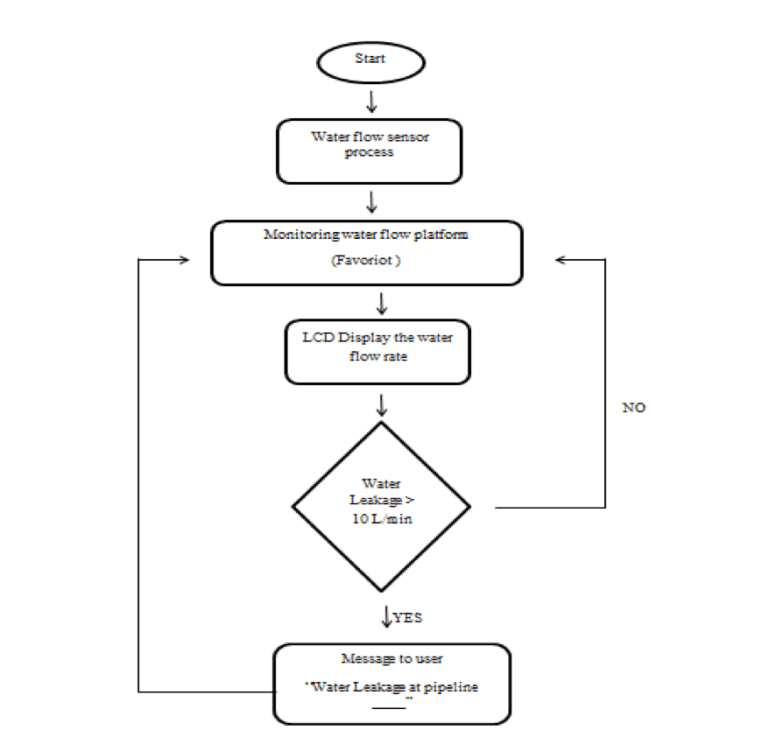
This project is conducted based on the flow chart shown in figure 1. In the first stage, water will go through the water flow sensor and can monitor the water flow by using the Favoriot platform. The LCD will display also the water flow rate.

When the water flow rate more than 10 L/min for a certain time without no one use it to show that the water is leakage. After it detects the leakage occurs at the pipeline, the GSM will notify the user about the leakage.

Figure 1: Flowchart of the monitoring operation

Design Project

The design part of this project, it explained about the process of the monitoring water leakage.

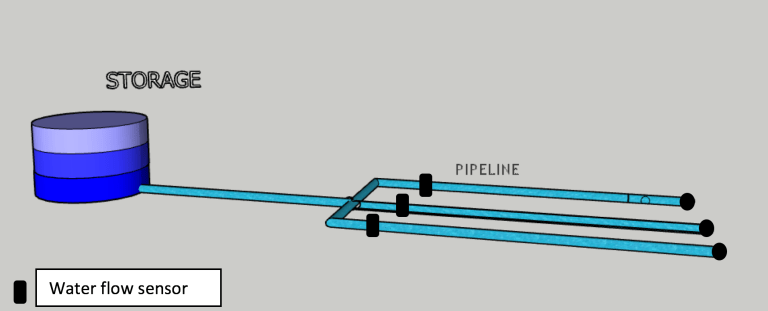
Figure 2: the design project using SketchUp software

Figure 2 shows the concept that will be used in this project. The water from the tank will flow the water to every junction pipeline. And every junction will place the water flow sensor to monitor the flow rate of the water. When the water flow rate increase more than a threshold that was set up, that is mean there is some part is leaking in the pipeline. For monitoring part, Favoriot will monitor the graph of the flow rate water and LCD will show the flow rate value for every second.

[Note: This project is being done by UTHM, our FAVORIOT’s University’s collaborator. Article was written by Mohd Amir Ariff Anuar, FKEE UTHM]

Copyright © 2026 All rights reserved