Posts in HOW-TO

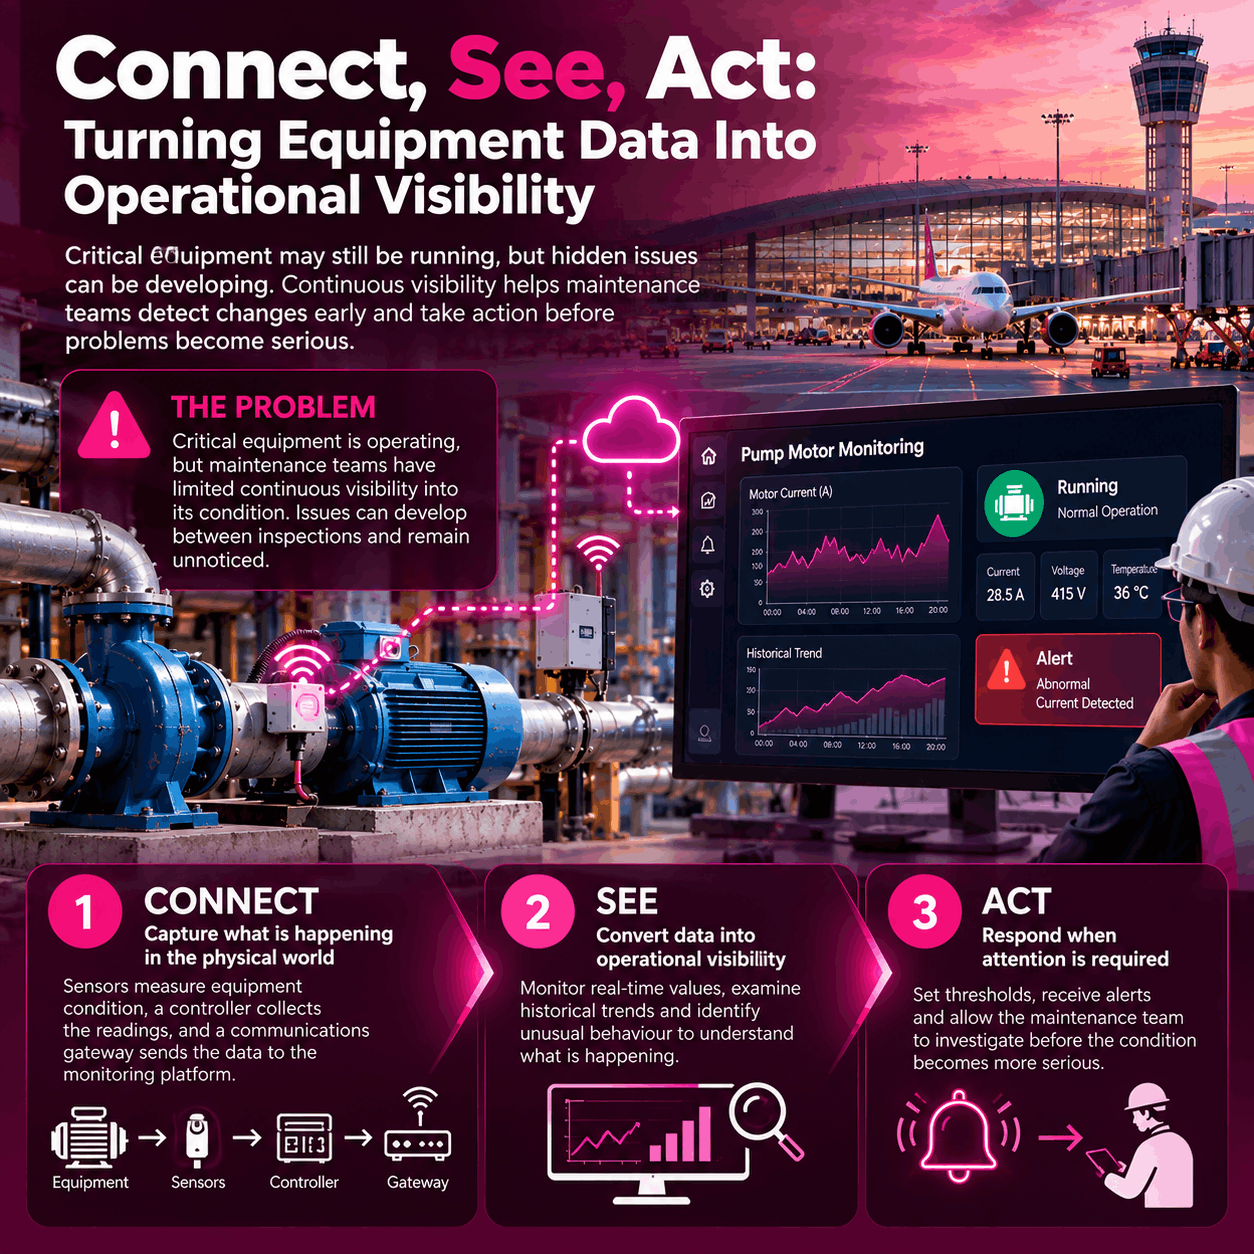
How Favoriot Reduces Operational Blindness Through Connect, See and Act

How Favoriot Reduces Operational Blindness Through Connect, See and Act

August 3rd, 2026 Posted by BLOG, HOW-TO, Internet of Things, IOT PLATFORM, Operational Blindness 0 thoughts on “How Favoriot Reduces Operational Blindness Through Connect, See and Act”

Many organizations invest heavily in IoT sensors, cloud platforms, and dashboards, yet still struggle with delayed responses, equipment failures, rising costs, and operational inefficiencies. The issue is often not a lack of data but a lack of operational visibility.

This is known as Operational Blindness, where organizations collect vast amounts of operational data but cannot turn it into timely decisions and effective actions.

Favoriot addresses this challenge through a simple yet powerful framework:

Connect

Operational visibility begins with connecting assets, devices, and systems. Favoriot securely gathers data from sensors, machines, meters, SCADA systems, and other operational technologies using open communication standards.

More importantly, it transforms fragmented information into trusted operational data, providing a reliable foundation for decision-making.

Without trusted data, organizations simply automate uncertainty.

See

Collecting data is only the first step. Dashboards may display numbers, but they rarely explain what those numbers mean.

Favoriot converts operational data into operational visibility by adding context, trends, alerts, asset information, and location intelligence. Instead of forcing users to search through thousands of readings, the platform highlights abnormal conditions, identifies operational risks, and helps decision makers understand what requires immediate attention.

The goal is not to display more data but to make operations visible.

Act

Visibility creates value only when it leads to action.

Favoriot enables organizations to respond quickly through automated alerts, notifications, workflow integration, and operational tracking. Teams know what happened, where it happened, who should respond, and whether corrective action has been completed.

This closes the gap between monitoring and execution, reducing delays and improving accountability.

From Connected Assets to Business Outcomes

Favoriot’s approach follows a continuous operational improvement cycle:

Each action generates new operational knowledge, helping organizations improve future decisions and continuously reduce Operational Blindness.

Applicable Across Every Industry

The Connect • See • Act framework applies across many sectors, including:

  • Smart Buildings
  • Water Utilities
  • Manufacturing
  • Smart Cities
  • Energy Management
  • Cold Chain Logistics
  • Agriculture
  • Environmental Monitoring

Regardless of the industry, the objective remains the same: transform disconnected operational data into coordinated operational decisions.

Beyond an IoT Platform

Traditional IoT platforms focus on connecting devices and displaying dashboards. Favoriot goes a step further by helping organizations answer the questions that matter most:

  • What is happening?
  • Why is it happening?
  • Where is it happening?
  • Who should respond?
  • Has the issue been resolved?

These answers create operational visibility, which is essential before organizations can fully benefit from AI and autonomous operations.

Conclusion

Technology alone does not eliminate Operational Blindness. Organizations must first connect their operations, gain clear visibility into what is happening, and ensure every important event leads to the right action.

This is why Favoriot is evolving beyond a conventional AIoT platform into an Operational Visibility Platform (OVP). Guided by the Connect • See • Act framework, it enables organizations to move beyond collecting data and begin making faster, smarter, and more confident operational decisions.

How Favoriot Solves Operational Blindness

July 29th, 2026 Posted by BLOG, HOW-TO, Internet of Things, IOT PLATFORM, Operational Blindness 0 thoughts on “How Favoriot Solves Operational Blindness”
How Favoriot Solves Operational Blindness
Favoriot
Operational Visibility Platform
Whitepaper · 2026

How Favoriot SolvesOperational Blindness

A practical framework for turning disconnected IoT signals into trusted operational context, accountable action and measurable outcomes.

Prepared by FavoriotConnect. See. Act.
Author perspectiveDr. Mazlan Abbas, CEO and Co-founder
3Connected capabilities: Connect, See, Act
13Sections covering method, delivery and outcomes
5Phase delivery roadmap for the first pilot
6Success measures across time, cost and ownership
Executive Summary

Connected organisations can still be blind

Operational blindness occurs when an organisation has devices, data, dashboards and alerts, yet decision-makers still cannot tell what is happening, why it matters, who should respond or whether the response worked.

The organisation sees measurements. It does not yet see operational truth.

Favoriot addresses this gap by serving as the operational visibility layer between field devices and business action. It gathers data from sensors and gateways, attaches context to that data, presents role-based views, detects meaningful conditions, routes alerts to responsible people and preserves an evidence trail from signal to outcome.

The approach is organised around three connected capabilities: Connect operational assets, See the situation with context, and Act through workflows and accountability. This is supported by device management, data ingestion, dashboards, rules, alerts, APIs, reporting and partner-led deployment services.

1. Definition

What is operational blindness?

Operational blindness is the condition where an organisation collects operational data at scale but still cannot make confident, timely decisions because the data does not close the loop to action.

1

Data without context

Readings arrive, but teams cannot see what is normal, abnormal, urgent or related to a specific asset, process or service level.

2

Insights without workflow

Information stays in dashboards and reports instead of entering maintenance, escalation, compliance or service processes.

3

Alerts without action

Notifications are sent, but ownership, acknowledgement, escalation, resolution and learning are not consistently recorded.

2. Symptoms

How operational blindness appears in daily work

Too many dashboards, too little clarity

Each department sees its own screen, while the end-to-end operating picture remains fragmented.

Problems are found through complaints

Customers, operators or auditors discover failures before the monitoring system triggers a useful response.

Manual checking remains the safety net

Staff still rely on spreadsheets, phone calls, WhatsApp groups and physical inspections to confirm what systems should already know.

Alerts become background noise

Thresholds generate many low-value notifications. Critical events are hidden among repetitive or poorly prioritised alarms.

Decisions depend on individual memory

The organisation cannot preserve operational knowledge when experienced staff are unavailable or leave.

Reports explain yesterday

Management receives summaries after the opportunity to prevent downtime, loss, waste or service failure has passed.

3. Favoriot Method

The Connect, See, Act operating model

Favoriot is positioned not merely as a place to store sensor data, but as the operating layer that shortens the distance between an event occurring and the right person taking the right action.

Stage 1

Connect

Bring devices, gateways, protocols and external systems into a common data environment.

MQTTHTTP/RESTGateways
Stage 2

See

Turn measurements into operational meaning using context, dashboards, rules and history.

DashboardsRulesTrends
Stage 3

Act

Route exceptions into alerts, escalation and accountable workflows, then record the result.

AlertsAPIReports
4. Connect

Create a dependable operational data foundation

Operational visibility begins with trustworthy data capture. Favoriot accepts telemetry from many device types, gateways and network arrangements, allowing organisations to connect brownfield and new deployments without forcing every use case into one hardware design.

  • Device registration and lifecycle management
  • Telemetry ingestion through common IoT protocols
  • Cloud or enterprise deployment options
  • Multi-site and multi-tenant organisation
  • APIs for business systems, analytics and reporting
  • Gateway support for field protocol conversion

What this cures

Missing data: blind spots caused by unconnected assets.

Data silos: separate readings that cannot be compared.

Weak traceability: uncertainty about device identity, source and time.

Scaling friction: each new site needing a new monitoring stack.

5. See

Convert telemetry into operational meaning

Raw readings rarely carry enough meaning for an operations manager. Favoriot helps organise data around assets, sites, conditions and responsibilities so that the user can distinguish routine variation from a developing risk.

Context

Relate each reading to its device, asset, location, process, baseline and operating limit.

Role-based views

Present the same operational truth differently for technicians, managers, executives and customers.

History and trends

Show patterns over time so teams can detect drift, recurring faults and early warning signals.

Rules

Identify combinations of readings that matter, rather than relying only on simple single-value thresholds.

Evidence

Preserve time-stamped records for audit, compliance, service review and root-cause analysis.

Shared picture

Give stakeholders one common reference instead of conflicting spreadsheets and informal updates.

6. Act

Make every important signal actionable

Visibility creates business value only when it changes what people do. Favoriot supports the movement from detection to acknowledgement, escalation, response and closure.

Operational eventPlatform responseHuman or system actionEvidence retained
Cold-room temperature risesRule validates persistence and severityNotify duty technician, escalate if unacknowledgedEvent time, acknowledgement, response and recovery
Machine vibration driftsTrend indicates developing abnormalityCreate maintenance inspection or work requestTrend, intervention and post-maintenance condition
Water level crosses risk bandSite, rainfall and level are shown togetherNotify response team and relevant authorityAlert path, decision time and field update
Indoor air quality degradesThreshold and duration rule triggersAdjust ventilation and inform facility managerBefore-and-after readings and action record
7. Closed-Loop Accountability

The difference between an alert and an outcome

Many monitoring systems stop when a notification is sent. That is where operational blindness often begins. A closed loop continues until someone owns the issue, responds, confirms the result and records what was learned.

A

Acknowledge

Confirm that the responsible person or team has received and accepted the issue.

R

Respond

Capture what action was taken, by whom, and within which service or safety target.

V

Verify

Use fresh operational data to confirm that the action restored the required condition.

8. Platform and Partner Roles

Favoriot is the engine. The solution partner drives delivery.

Operational blindness is not solved by software alone. Successful delivery combines Favoriot’s platform capabilities with field engineering, domain knowledge, workflow design and customer ownership.

FavoriotSystem Integrator or Solution PartnerCustomer
Data ingestion, device management and platform servicesSensor selection, installation and field networkingBusiness priorities and risk tolerance
Dashboards, rules, APIs, alerts and data historyDomain configuration, workflow design and local supportDecision ownership and operating procedures
Scalable cloud or enterprise platform foundationSolution packaging, commissioning and managed serviceResponse teams, escalation paths and performance targets
9. Delivery Roadmap

Start with one decision that matters

The recommended starting point is not a large platform replacement. It is a focused operational visibility pilot built around a costly, frequent or high-risk decision.

1. Diagnose the blind spot

Identify the operational question that teams cannot answer reliably today. Map missing signals, delayed information, unclear ownership and current workarounds.

2. Define the decision and response

Agree what condition requires attention, who owns it, how quickly they must respond and what evidence proves closure.

3. Connect the minimum data set

Deploy or connect only the sensors and systems needed to support the selected decision.

4. Configure visibility and action

Create dashboards, contextual rules, alerts, escalation and reporting around the operating process.

5. Measure and expand

Compare response time, downtime, losses, manual effort, compliance and service outcomes before and after the pilot.

10. Success Measures

Measure improved decisions, not just connected devices

MTTDMean time to detect a meaningful operational condition
MTTAMean time for the responsible person to acknowledge
MTTRMean time to respond, recover or resolve
%Critical events with a named owner and recorded closure
RMAvoided loss from downtime, spoilage, waste or service failure
HoursManual inspection and reporting time removed
11. Use Cases

Where Favoriot can reduce operational blindness

High relevance

Smart buildings

HVAC performance, indoor air quality, energy, equipment condition, leaks and occupant comfort.

High relevance

Manufacturing

Machine health, production conditions, downtime causes, utility consumption and maintenance response.

High relevance

Cold chain and logistics

Temperature excursions, storage conditions, delivery handovers, asset location and compliance evidence.

Emerging

Water and environmental monitoring

Water levels, quality indicators, remote assets, flood risk, emissions and regulatory reporting.

Emerging

Agriculture

Soil, weather, irrigation, fertigation, livestock conditions and farm-to-fork traceability.

Emerging

Smart cities and public services

Distributed assets, service incidents, multi-agency visibility and response coordination.

12. Why Favoriot

Built to connect operational data with real work

IoT-native foundation

Favoriot is designed for device data, telemetry, rules, dashboards and operational events rather than being adapted from a general reporting tool.

Flexible deployment

Organisations can adopt cloud services or enterprise deployment based on data, governance and operating requirements.

Partner-ready delivery

System integrators can combine Favoriot with their field expertise, hardware, services and managed support.

Outcome-based positioning

The platform is framed around decision speed, accountability and operational evidence, not the number of dashboard widgets.

Favoriot helps organisations move from connected assets to visible operations, and from visible operations to accountable action.

13. Recommended First Engagement

Operational Blindness Discovery Workshop

A short discovery workshop can identify one practical starting point and build agreement across operations, IT, management and the delivery partner.

Five decision questions

  • Which operational event causes the greatest avoidable cost or risk?
  • How is that event detected today?
  • What information is missing, delayed or distrusted?
  • Who owns the response and escalation?
  • What result proves the issue has been resolved?

Workshop outputs

  • Operational blindness assessment summary
  • Top operational blind spots
  • Visibility gap map
  • Estimated business impact
  • Recommended pilot and high-level architecture
  • Success metrics and measurement plan

Operational Blindness Index (OBI) – Self Assessment

July 18th, 2026 Posted by BLOG, HOW-TO, Operational Blindness 0 thoughts on “Operational Blindness Index (OBI) – Self Assessment”

Technology is rarely the reason organisations get caught off guard. Visibility is. A company can have dashboards, sensors, and reports running in the background and still be operating half blind, because none of that guarantees leadership actually sees what is happening in real time. The distance between what is really going on and what people believe is going on tends to grow quietly. Nobody notices it until it costs something: a decision built on outdated numbers, a failure that should have been obvious sooner, a delay nobody can fully explain afterward.

You cannot close a gap you have never measured. Before adding another dashboard or another AI initiative, it helps to ask a simpler question first: right now, how much of your operation can you actually see, and how quickly does that visibility lead to action. Answering that honestly is harder than it sounds, which is exactly why a structured self assessment helps. It turns a vague feeling that “we should have better visibility” into an actual score across specific areas, so instead of guessing where to start, you know.

That is what the Operational Blindness Index is built to do. Not a full diagnosis on day one, just an honest starting point.

The Operational Blindness Index
Self assessment
1 / 10

The Operational Blindness Index

Ten questions across five dimensions of operational visibility. Answer honestly, based on how things actually work today, not how they are supposed to work. It takes about three minutes.

01
Asset Visibility
02
Process Visibility
03
Data Freshness
04
Decision Speed
05
Automation Readiness
SCORE 0 / 40

Dimension breakdown

Contact Favoriot to solve your Operational Blindness issue.

Copyright © 2026 All rights reserved