Reasons to Consider IoT
January 17th, 2025 Posted by favoriotadmin BLOG 0 thoughts on “Reasons to Consider IoT”Today, we will discuss the key reasons why organisations should consider adopting IoT (Internet of Things).
The diagram highlights three main benefits: Gain, Retain, and Innovate. Let’s go through each of these in a simple and structured way.
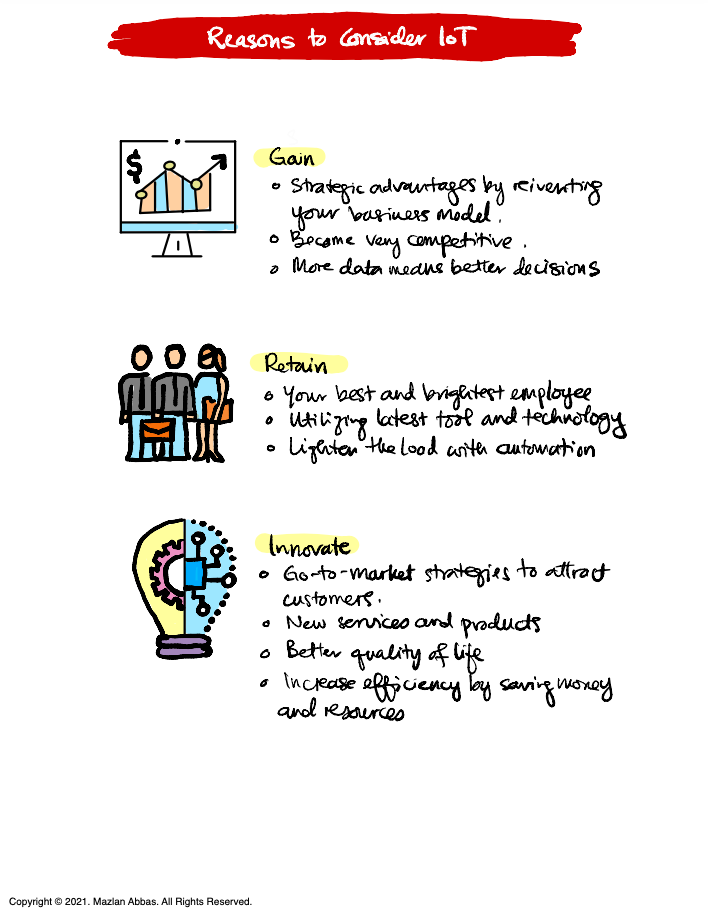
1. Gain
The first reason to consider IoT is the opportunity to gain strategic advantages and stay competitive in the market.
Strategic Advantages: IoT allows businesses to reinvent their business models, offering smarter, data-driven services.
- Example: A retail store using IoT to track customer preferences and improve in-store experiences.
Become Competitive: By adopting IoT, businesses can stay ahead of competitors who are slow to embrace technology.
- Example: A logistics company using IoT sensors to optimise delivery routes.
Data-Driven Decisions: IoT provides real-time data, which helps in making better decisions faster.
- Example: A manufacturer monitoring equipment performance to reduce downtime.
2. Retain
The second reason is about retaining the best employees and maintaining operational efficiency.
Attract and Retain Talent: Employees prefer organisations that use the latest tools and technology to make their work easier and more efficient.
- Example: Providing engineers with IoT-enabled tools to monitor and control operations remotely.
Ease Workloads with Automation: IoT automates repetitive tasks, allowing employees to focus on higher-value activities.
- Example: Smart systems in a factory automatically managing inventory levels.
When employees feel supported by modern technology, they are more likely to stay with the organisation.
3. Innovate
The third and perhaps most exciting reason is the ability to innovate with IoT.
Go-to-Market Strategies: IoT enables businesses to develop new strategies to attract and retain customers.
- Example: A car rental company using IoT for keyless entry and real-time vehicle tracking.
New Products and Services: IoT opens doors to create entirely new offerings that improve the customer experience.
- Example: Wearable health trackers offering personalised fitness insights.
Better Quality of Life: For individuals and society, IoT can enhance convenience, safety, and overall well-being.
- Example: Smart homes with automated lighting and security systems.
Efficiency and Savings: IoT reduces costs by optimising resources and processes.
- Example: Smart irrigation systems saving water in agriculture.
Key Takeaway
The main takeaway is simple: IoT is not just about adopting technology — it’s about creating value by:
- Gaining a competitive edge.
- Retaining top talent and improving efficiency.
- Innovating to improve products, services, and quality of life.
IoT is the key to staying relevant in today’s fast-changing world.
Let’s discuss: Which of these reasons resonates most with your business or personal goals? How can IoT help you achieve them? Let’s explore together!
[Download the FREE eBook — IoT Notes by Mazlan Abbas]