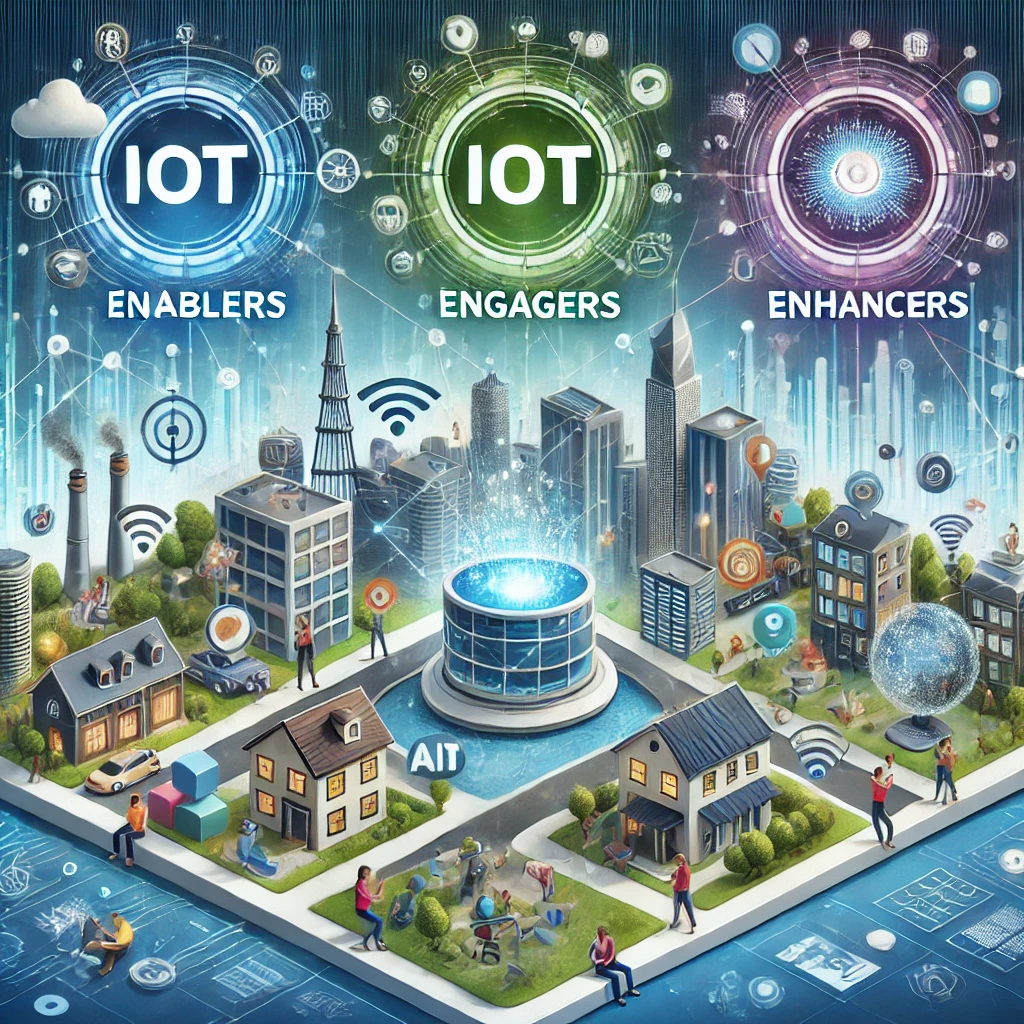
The Internet of Things (IoT) has always been a fascinating space for me.
It’s incredible how a concept that seemed futuristic not too long ago has become a driving force in the tech industry.
IoT has opened up a world of opportunities, with market projections ranging from $2 trillion to $14 trillion. That’s mind-boggling! But here’s the thing – jumping into IoT without understanding your role in the ecosystem is like trying to build a house without knowing which part you’re responsible for.
Let me walk you through this ecosystem as I see it, breaking it into three leading roles: Enablers, Engagers, and Enhancers.
Enablers: The Builders of IoT
Think of Enablers as the architects and construction workers of the IoT world.
They’re laying the groundwork – developing the technologies, hardware, and infrastructure that make IoT possible. Without them, there’s no IoT, period.
When I worked at MIMOS Berhad, Malaysia’s national R&D centre, I saw how challenging this role can be. You’re not just building products but creating the tools others will use to develop their solutions.
Companies like Cisco and Intel are perfect examples. They design the chips, the communication protocols, and the platforms that allow data to flow between devices.
At FAVORIOT, our platform plays a similar role.
It’s a foundation for developers to connect devices and scale their applications. Being an Enabler means thinking about scalability, security, and reliability ahead of time.
It’s demanding but also incredibly rewarding because you’re shaping the future of IoT.
Engagers: Bringing IoT to Life
If Enablers are the builders, Engagers are the storytellers.
They take the raw capabilities provided by Enablers and turn them into solutions that make sense to the everyday user. This is where IoT comes alive for people.
I love this role because it’s all about creativity and problem-solving.
Engagers design and deliver IoT services that address real-world needs. For instance, Nest’s smart thermostats made IoT relatable and accessible to millions of households.
While leading REDtone IOT, I saw how challenging it is to balance innovation with practicality.
You have to create solutions that are not only cutting-edge but also easy to use and affordable.
Whether it’s developing intelligent farming systems, health monitoring devices, or city-wide solutions, Engagers connect IoT to its audience.
At FAVORIOT, we stepped into this role with projects like RAQIB, a health monitoring system for Hajj pilgrims.
The idea was simple: make it easier for caregivers to monitor pilgrims’ health remotely. It’s about identifying and meeting a need with IoT tools.
Enhancers: Turning Data into Action
Here’s where things get exciting.
Enhancers take all the data IoT devices collect and turn it into something meaningful.
They’re the analysts, the data scientists, and the visionaries who uncover patterns and insights that help people make better decisions.
This role is close to my heart because it’s where IoT’s actual value is unlocked.
For example, RAQIB isn’t just about collecting health data – it’s about analysing it to predict potential issues and alert caregivers. Without that intelligence layer, the data would be numbers on a screen.
Enhancers use AI and machine learning technologies to transform raw data into actionable insights.
Companies like Palantir and Splunk are masters at this.
They build platforms that help businesses make sense of complex data. It’s a challenging role but incredibly impactful, especially as IoT continues to generate more and more data daily.
At Favoriot, we are now enhancing our IoT platform with Agentic AI, making it an “AIoT”.
Where Do You Fit In?
So, how do you decide where you belong in this ecosystem?
Should you build the infrastructure as an Enabler, create applications as an Engager, or analyse the data as an Enhancer?
Here’s my advice: start with what you’re good at.
If you’re a tech wizard with a hardware and software development knack, the Enabler role might be for you.
If you understand market needs and enjoy creating user-centric solutions, focus on being an Engager. And if data is your thing, Enhancers have plenty of opportunities for innovation.
At FAVORIOT, we started as Enablers, building our IoT platform. Over time, we expanded into the Engager and Enhancer roles by creating solutions like Favorsense, a crowdsensing platform, RAQIB and now become AIoT platform.
It’s a natural progression, but it all began with identifying and focusing on our strengths.
The Real Power of IoT
At its core, IoT isn’t just about connecting devices; it’s about connecting insights.
The more devices you have collecting data, the more opportunities there are to make meaningful discoveries. But here’s the catch – you need the right tools and expertise to turn that data into something valuable.
That’s why Enhancers are so crucial.
With advanced analytics, they can predict equipment failures, improve operational efficiency, or even save lives.
It’s about more than just technology; it’s about creating solutions that make a difference.
Let’s Shape the Future Together
The IoT landscape is vast, and the opportunities are endless.
But success comes down to understanding your role – whether you’re an Enabler, an Engager, or an Enhancer – and playing to your strengths.
Don’t try to do everything.
Focus on where to add the most value, and the rest will follow.
For me, IoT is more than just a field of work – it’s a mission to create smarter, more connected communities.
Whether you’re building the infrastructure, designing the applications, or analysing the data, you’re contributing to something bigger: a future where technology works seamlessly to improve lives.
So, let’s get out there and make it happen.
The IoT revolution is just starting, and there’s plenty of room for us to make our mark.
Where will you begin?


